Surface quality is a critical factor in machining, grinding, polishing, casting, and many other manufacturing processes. In engineering practice, the terms surface finish and surface roughness are frequently used, sometimes interchangeably, which can cause confusion during design, specification, and inspection.
This guide provides a systematic, technical comparison of surface finish and surface roughness, explains common parameters and standards, and outlines how to specify and measure surface characteristics in a practical and reliable way.
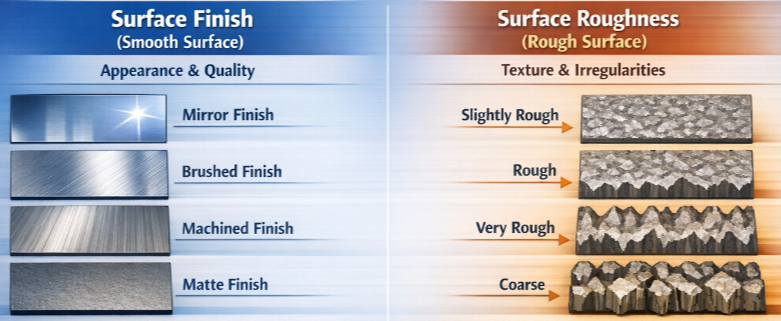
Core Definitions and Conceptual Differences
Surface texture is a general term that encompasses all the small-scale geometric features of a surface. Surface finish and surface roughness are related but not identical concepts within this broader domain.
What Is Surface Roughness?
Surface roughness refers specifically to the fine, closely spaced deviations from the nominal surface, typically created by the manufacturing process itself (such as tool marks from turning or feed marks from milling). It is usually quantified using statistical or profile-based parameters calculated over a sampling length or evaluation length.
Key characteristics of roughness:
- Represents short-wavelength surface irregularities
- Directly influenced by tool geometry, feed rate, cutting speed, and process conditions
- Typically measured in micrometers (µm) or microinches
What Is Surface Finish?
Surface finish is a broader and more practical term that refers to the overall condition and quality of a surface. It usually includes roughness but can also consider waviness, lay (direction of the texture), defects (scratches, pits, pores), and sometimes surface integrity aspects such as microcracks or recast layers. In many industrial contexts, “surface finish” is used as an umbrella term for the entire surface texture specification.
Key characteristics of surface finish:
- Combines multiple aspects of surface texture (roughness, waviness, lay)
- Often tied to functional requirements such as sealing, friction, aesthetics, coating adhesion, and fatigue resistance
- Expressed on drawings as a set of texture symbols, values, and notes, not just a single roughness value
Surface Texture Hierarchy
Surface texture can be conceptually divided into different wavelength ranges:
| Component | Description | Typical Wavelength Range | Main Influencing Factors |
|---|---|---|---|
| Form | Macro-deviation from nominal geometry (flatness, roundness) | Above several millimeters | Machine tool geometry, fixturing, alignment |
| Waviness | Medium-scale undulations superimposed on the form | Approximately 0.8 mm to 10 mm (application dependent) | Machine vibration, chatter, thermal drift, tool deflection |
| Roughness | Fine-scale irregularities arising from the process | Below about 0.8 mm | Cutting parameters, tool edge, abrasive size, lubrication |
Surface finish is an application-oriented interpretation of this hierarchy that focuses on what actually matters for function and performance.
Key Roughness Parameters and Their Meaning
Multiple parameters exist to describe surface roughness. Standards such as ISO 4287 and ASME B46.1 define their calculation. The most commonly used parameters differ by region and industry, but a core set appears on the majority of technical drawings.
Amplitude Parameters (Profile-Based)
Amplitude parameters describe the vertical deviations of the surface profile from a reference line over a specific sampling length.
1. Ra (Arithmetic Mean Roughness)
Ra is the arithmetic average of the absolute values of the profile height deviations from the mean line over an evaluation length. It is widely used because it is simple and robust, but it does not fully represent peak-valley extremes.
Typical ranges:
- Rough turning: Ra ≈ 3.2–6.3 µm
- Fine turning / milling: Ra ≈ 0.8–3.2 µm
- Grinding: Ra ≈ 0.1–0.8 µm
- Lapping / superfinishing: Ra < 0.1 µm
2. Rz (Average Maximum Height of the Profile)
Rz is defined as the average of the vertical distance between the highest peak and the lowest valley within several adjacent sampling lengths. Compared to Ra, Rz is more sensitive to isolated peaks or valleys and often correlates better with sealing and bearing performance.
Typical approximate relationship (process and material dependent):
Rz ≈ 4 × Ra to 10 × Ra
3. Rt (Total Height of the Profile)
Rt is the vertical distance between the highest peak and lowest valley within the evaluation length. It is highly sensitive to outliers and is often used to detect occasional defects that may not significantly influence Ra.
4. Rq (Root Mean Square Roughness)
Rq (or RMS roughness) is the root mean square of the profile deviations. It tends to weigh larger deviations more heavily than Ra and is common in optical and thin-film applications.
Waviness and Lay: Beyond Roughness
While roughness describes short-wavelength features, waviness and lay provide complementary information necessary for a complete surface finish specification.
Waviness Parameters
Waviness refers to medium-scale deviations that occur over longer wavelengths than roughness. These deviations are usually caused by machine tool vibration, workpiece deflection, feed fluctuations, or thermal expansion. Standards define waviness parameters analogous to roughness parameters, often using the prefix W instead of R (for example, Wa, Wz).
Key aspects:
- Can affect sealing, especially over long sealing lines
- Strongly influences noise and vibration behavior in rotating machinery
- Often controlled by process stability rather than tool micro-geometry
Lay (Surface Pattern Direction)
Lay describes the predominant direction of the surface pattern. It is determined by the manufacturing process: for example, turning produces a circumferential lay on a shaft, while face milling can produce a circular or radial lay pattern.
Common lay directions on drawings include:
| Lay Type | Description | Typical Process | Functional Considerations |
|---|---|---|---|
| Parallel | Predominant lay direction parallel to the reference axis | Longitudinal turning, grinding along axis | Can guide lubrication flow along the axis |
| Perpendicular | Lay direction perpendicular to the reference axis | Face milling, facing operations | Often preferred for sealing faces to avoid leakage paths |
| Circular | Lay pattern follows circular paths | Turning on flat faces, rotary lapping | Affects friction in rotary seals |
| Crossed / Multidirectional | Intersecting or random lay directions | Grinding, honing, sandblasting | Can provide stable lubricant retention |
Surface finish specification normally includes both numerical roughness limits and an indication of the lay direction when functional performance depends on it.
Standards and Notation on Engineering Drawings
Surface finish specifications are governed by international and national standards to ensure consistent interpretation between designers, manufacturers, and inspectors.
Major Standards
Commonly used standards include:
- ISO 4287: Geometrical product specifications (GPS) — Surface texture: Profile method — Terms, definitions and surface texture parameters
- ISO 1302: Indication of surface texture in technical product documentation
- ASME B46.1: Surface Texture (Surface Roughness, Waviness, and Lay)
These standards define:
– The terminology of roughness, waviness, and related parameters
– Calculation methods, filtering rules, sampling lengths, and evaluation lengths
– Graphical symbols and notation conventions for engineering drawings
Surface Texture Symbols
On drawings, surface finish is indicated by a standardized symbol (often a check-mark-like graphical sign) combined with numerical values and additional letters or notations. These annotations can convey:
– Maximum roughness value (for example, Ra 1.6 µm)
– Range specifications (for example, 0.4 µm ≤ Ra ≤ 0.8 µm)
– Machining allowances or removal requirements
– Process restrictions (e.g., “machining required”, “no machining allowed”)
– Lay direction symbols
Clear specification on drawings is crucial to avoid misinterpretation that may lead to underperforming components or unnecessary manufacturing costs.
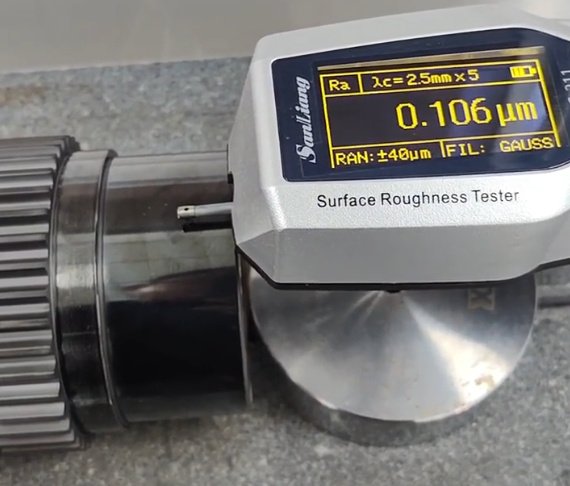
Measurement Methods: From Contact Stylus to Optical Systems
The choice of measurement system directly influences the reliability of surface roughness and finish evaluations. Measurement techniques can broadly be divided into contact and non-contact methods.
Contact Stylus Profilometers
Contact stylus instruments are widely used and are often considered the reference method for profile-based parameters such as Ra and Rz.
Characteristics:
– A diamond-tipped stylus with a defined radius (commonly 2 µm or 5 µm) is traversed across the surface
– Vertical movement of the stylus is converted into electrical signals and digitized
– Filters are applied to separate form, waviness, and roughness, according to standardized cutoff lengths
Typical parameter range:
– Roughness: from approximately Ra 0.01 µm to several tens of micrometers
Contact methods are suitable for many metals and hard surfaces but may not be ideal for soft, delicate, or highly contoured surfaces.
Optical and Non-Contact Methods
Non-contact measurement techniques use light, focus, or other physical principles to characterize surface topography without physically touching the surface.
Common methods:
– White-light interferometry
– Confocal microscopy
– Focus variation
– Laser scanning systems
Features:
– Can provide 3D surface maps (areal parameters) rather than 2D profiles only
– Suitable for very smooth surfaces (for example, polished optics) and microstructures
– Sensitive to reflectivity, color, and transparency of the surface
Non-contact methods are particularly useful when the surface finish has a functional 3D pattern or when the surface is easily damaged by stylus contact.
Profile vs Areal Parameters (2D vs 3D)
Traditional roughness parameters such as Ra and Rz are 2D profile measures recorded along a line. Modern surface metrology increasingly uses 3D areal parameters that describe a measured area, which can better capture complex surface features.
Profile Parameters
Profile parameters (such as Ra, Rz, Rt, Rq) are calculated from a single measuring trace. They are widely standardized and readily measured with conventional profilometers, making them the most common in industrial practice.
Advantages:
– Simple and well standardized
– Compatible with legacy drawings and specifications
– Fast measurements
Limitations:
– Can miss directional non-uniformity across the surface
– Results may depend on the orientation of the measurement trace relative to the lay
Areal (3D) Parameters
Areal parameters are derived from a surface map and are typically defined in standards such as ISO 25178. They provide values such as Sa (areal mean roughness) and Sq (areal RMS roughness), which are analogues to Ra and Rq but over an area rather than a line.
Advantages:
– Better representation of surfaces with complex texture or anisotropic patterns
– More informative for functional properties such as fluid retention, contact area distribution, and wear behavior
Areal parameters are increasingly specified in applications requiring high precision and detailed functional analysis, though their widespread adoption depends on measurement equipment and company practice.
Functional Impact: Why Distinguishing Finish and Roughness Matters
Different functional requirements make specific aspects of surface finish more critical than others. Using only a single roughness parameter without understanding the broader finish context can lead to unsuitable surfaces.
Sealing Performance
Sealing surfaces often need a combination of low roughness and controlled waviness, with an appropriate lay direction:
– Too high roughness (large peaks and valleys) can provide leakage paths
– Excessively low roughness can reduce lubricant retention and cause dry running in dynamic seals
– Waviness over long sealing lines can create gaps that compromise sealing even if Ra is low
For static sealing applications, parameters like Rz and waviness height can be as important as Ra.
Friction and Wear
Tribological behavior (friction, wear, lubrication) depends heavily on surface finish:
– Surfaces with moderate roughness and certain lay patterns can store lubricants and reduce friction
– Surfaces that are too smooth can lead to boundary lubrication failure in some applications
– Directional lay can create channels for lubricant flow or cause directional wear patterns
Engine cylinder liners and sliding bearing surfaces are typical examples where surface finish specification goes beyond simple roughness limits.
Fatigue and Structural Integrity
Surface finish influences fatigue strength and crack initiation:
– Sharp valleys act as stress concentrators, reducing fatigue life
– Surface processing methods such as grinding, shot peening, or polishing modify both roughness parameters and residual stress state
For fatigue-critical components such as shafts and springs, roughness specification is often combined with process controls to ensure consistent surface integrity.
Specification Strategy: How to Define Surface Finish Requirements
Effective surface finish specification balances functional needs with manufacturability and cost. Overly tight or incomplete requirements are common obstacles in product development and production.
Selecting Appropriate Parameters
When defining surface finish on a drawing:
– Identify the primary functional requirements (sealing, sliding, fatigue, aesthetics)
– Choose roughness parameters that correlate with those functions (for example, Rz for sealing, Ra and Rq for general surface quality)
– Decide whether waviness limits or lay direction need to be explicitly controlled
– Use standardized parameters and symbols to avoid misinterpretation
Setting Numerical Values
Roughness values should be consistent with the capabilities of the intended manufacturing processes. Typical achievable ranges (approximate, process and material dependent) include:
– Turning: Ra ≈ 0.8–6.3 µm
– Milling: Ra ≈ 0.4–3.2 µm
– Grinding: Ra ≈ 0.1–1.6 µm
– Honing: Ra ≈ 0.05–0.4 µm
– Lapping / superfinishing: Ra below 0.05–0.1 µm
Specifying a much lower roughness than necessary for function can dramatically increase costs due to slower machining, additional finishing operations, and higher inspection demands.
Pain Points in Practice
Common issues related to surface finish vs surface roughness specification include:
– Drawings that specify only Ra but ignore waviness or lay, leading to surfaces that meet the number but not the function
– Use of non-standard parameters or outdated notation, causing confusion between suppliers and customers
– Mismatch between measurement method and specified parameter (for example, expecting 3D areal behavior from a single-line profile parameter)
– Insufficient information about measurement conditions (cutoff length, filter, sampling) that makes results difficult to compare
Addressing these issues requires clear communication and a consistent metrology framework within the organization and across the supply chain.
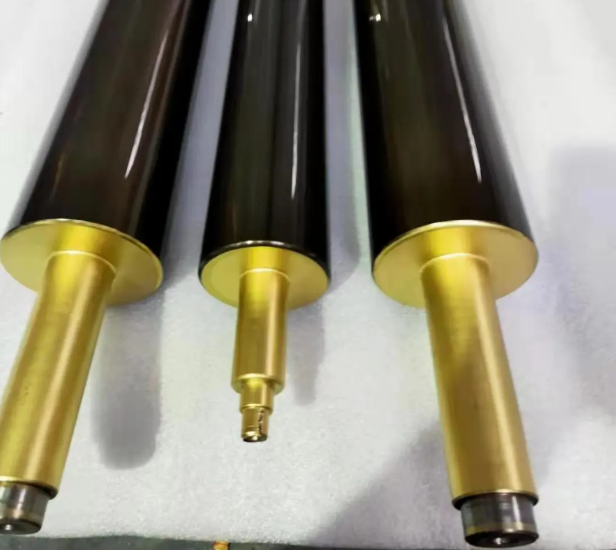
Surface Finish in Common Manufacturing Processes
Different manufacturing processes inherently produce different surface textures. Understanding these capabilities helps in aligning design requirements with realistic surface finish outcomes.
Turning and Milling
Characteristics:
– Surface formed by discrete tool passes with defined feed and nose radius
– Lay direction typically parallel or perpendicular to feed motion
– Roughness depends heavily on feed per revolution/tooth and tool condition
Typical roughness ranges (approximate):
– Roughing: Ra ≈ 3.2–12.5 µm
– Finishing: Ra ≈ 0.8–3.2 µm
Grinding
Characteristics:
– Surface generated by many abrasive grains with small depth of cut
– Produces fine roughness and often multidirectional lay
– Sensitive to wheel specification, dressing conditions, and cooling
Typical roughness ranges:
– General grinding: Ra ≈ 0.2–1.6 µm
– Fine grinding: Ra ≈ 0.05–0.4 µm
Honing, Lapping, and Superfinishing
These processes are used when very fine surfaces and controlled texture are needed.
– Honing: Creates cross-hatch patterns with controlled angles; often used in cylinders and hydraulics
– Lapping: Uses fine abrasives in a slurry between lap and workpiece; achieves low roughness and good flatness
– Superfinishing: Removes only small amounts of material to refine roughness and improve bearing performance
Typical roughness ranges:
– Honing: Ra ≈ 0.05–0.4 µm
– Lapping / superfinishing: Ra ≈ 0.01–0.1 µm
Common Misconceptions About Surface Finish and Roughness
Several misconceptions can lead to mis-specified or misinterpreted surface requirements.
“Surface Finish Equals Ra”
Relying solely on Ra to define surface finish ignores important aspects such as waviness, lay, peaks and valleys, and defects. Two surfaces can have the same Ra but very different functional behavior if their Rz, Rt, or lay differ significantly.
“Lower Roughness Is Always Better”
Very low roughness is not universally beneficial. For instance, in lubricated sliding contacts, extremely smooth surfaces may not retain lubricant well and can exhibit higher friction or wear. An optimal roughness range is often more important than minimizing the value.
“Any Instrument Measuring Ra Gives Comparable Results”
Differences in cutoff length, filtering, stylus radius, sampling speed, and trace orientation can cause significant variations in measured values. To compare results reliably, measurement conditions must follow the same standards and be clearly documented.
FAQs
What is the difference between surface finish and surface roughness?
Surface finish is a general term describing the overall surface quality, while surface roughness specifically measures the small, fine irregularities on a surface.
What does surface roughness mean?
Surface roughness refers to microscopic peaks and valleys on a surface, typically quantified using parameters such as Ra or Rz.
Which is more important, Ra or Rz?
Neither parameter is universally more important; it depends on the application. Ra is widely used and provides a general indication of surface quality. Rz captures the average peak-to-valley height and is often more sensitive to extremes that can affect sealing and contact behavior. Many specifications use both parameters or supplement Ra with Rz and other metrics to better reflect functional needs.
How should I choose the right surface finish specification?
Start from the functional requirements of the part: sealing, sliding behavior, fatigue strength, aesthetics, or coating adhesion. Select parameters that correlate with these functions (such as Ra, Rz, waviness, and lay direction) and set values that are achievable with the intended manufacturing process. Use standardized symbols and clearly defined measurement conditions to ensure consistent interpretation.